A Tale of Two Markets
As 2025 came to a close, the Halton real estate market didn’t deliver any dramatic twists — but it did quietly reinforce some important trends that buyers and sellers should be paying attention to.
December finished somewhat listlessly (yes, pun fully intended), with slower activity and longer timelines across most segments. That said, when you look a little closer, the story varies significantly depending on location and housing type. Oakville, Burlington, and Milton are not moving in lockstep — and neither are detached homes versus townhomes and condos.
Here’s what stood out as we wrapped up the year.
Detached vs. Attached Homes Across Halton
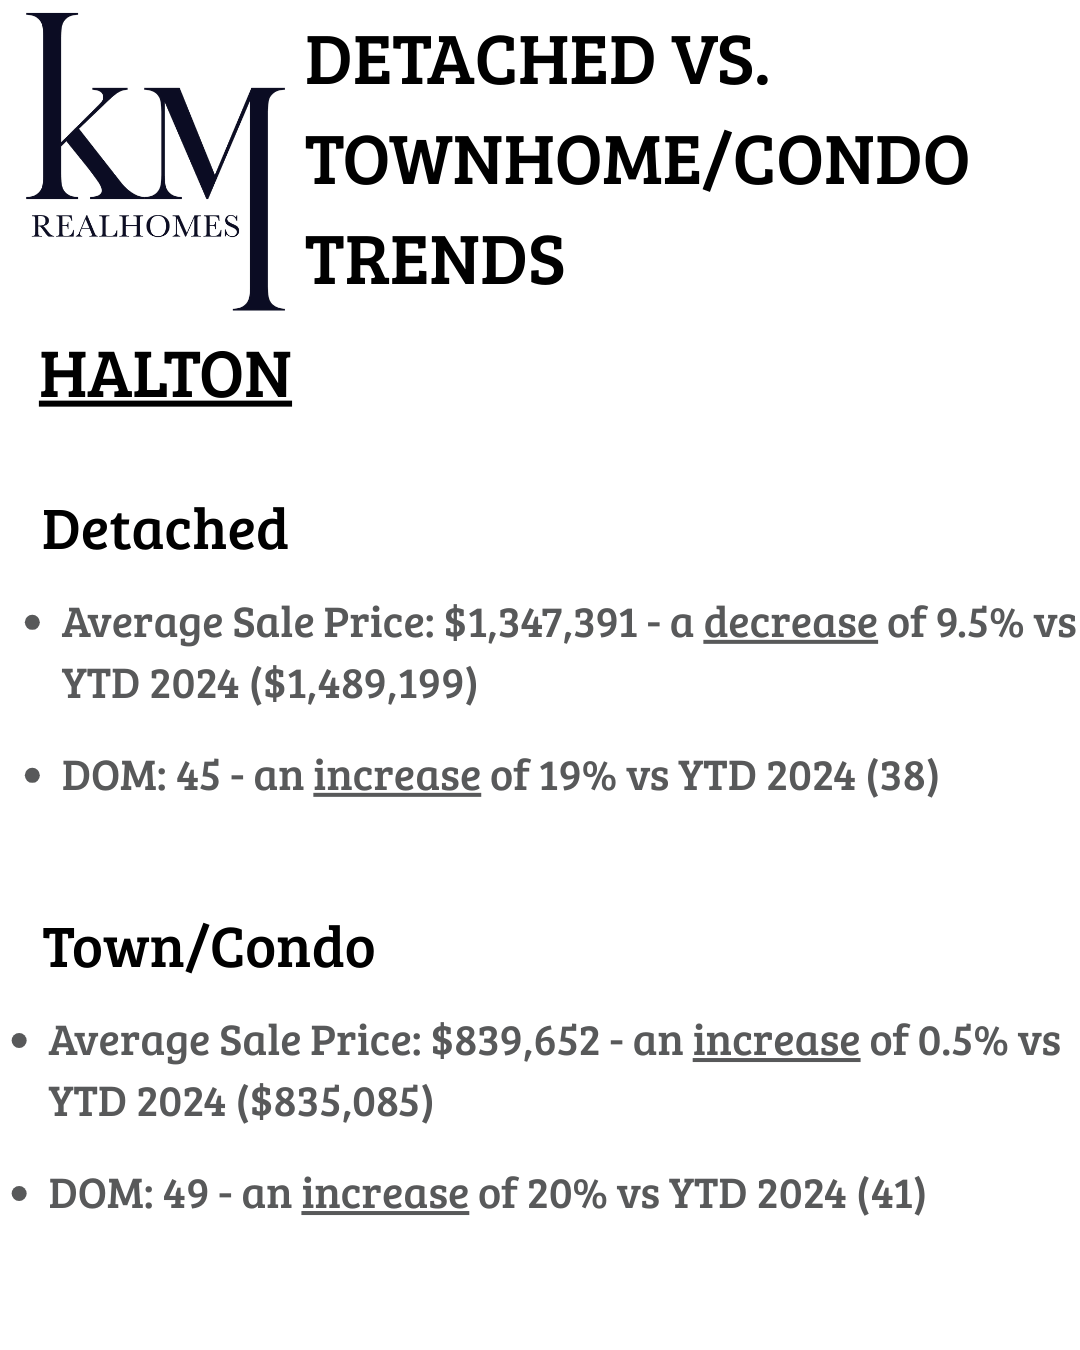
Across Halton as a whole, detached homes experienced the most noticeable price pressure in 2025.
Detached homes finished the year with an average sale price of $1,347,391, down 9.5% year over year, while days on market increased to 45 days.
Townhomes and condos, on the other hand, remained relatively stable, with an average sale price of $839,652, up a modest 0.5% year over year, though days on market also increased to 49 days.
The takeaway here is affordability. As borrowing costs and price sensitivity continue to shape buyer behaviour, attached homes have benefited from their lower entry point, keeping demand more consistent throughout the year.
Oakville: The Biggest Adjustment in 2025
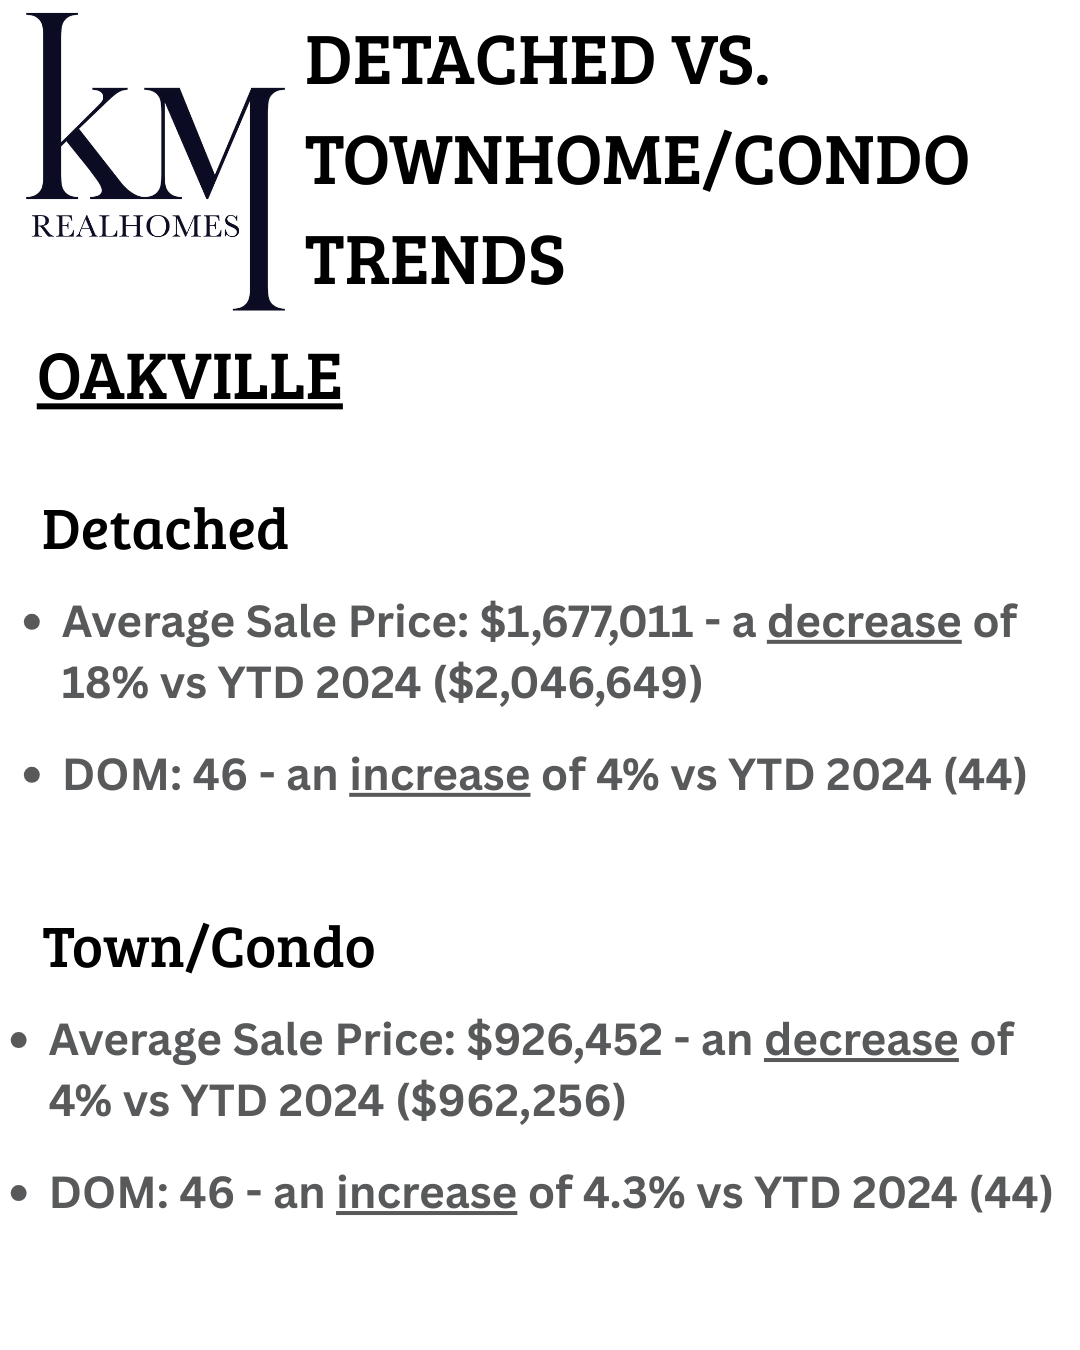
Oakville saw the most pronounced slowdown across Halton, particularly in the detached segment.
Detached homes in Oakville averaged $1,677,011, representing a significant 18% decrease year over year, with days on market increasing slightly to 46 days.
Townhomes and condos also softened, averaging $926,452, down 4% year over year, with similar days on market.
This adjustment has been driven largely by price. Oakville’s higher-end detached neighbourhoods — particularly 25–35 year old communities — are seeing more downsizers and fewer move-up buyers, creating opportunities for well-positioned purchasers who are patient and prepared.
For buyers, Oakville may offer some of the best value opportunities heading into 2026.
For sellers, realistic pricing and strong presentation are more important than ever.
Burlington: Holding Its Ground
Burlington has quietly been the most stable market in Halton.
Detached homes averaged $1,242,998, down 9.5% year over year, with days on market increasing to 46 days.
Townhomes and condos were a bright spot, finishing the year at $725,684, up 2% year over year, despite slightly longer selling timelines.
This relative stability reflects Burlington’s strong appeal across multiple buyer groups — from first-time buyers to downsizers — and its balanced mix of housing options.
Burlington sellers, particularly in the attached market, remain in a solid position as we head into the new year.

Milton: Price Sensitive but Active
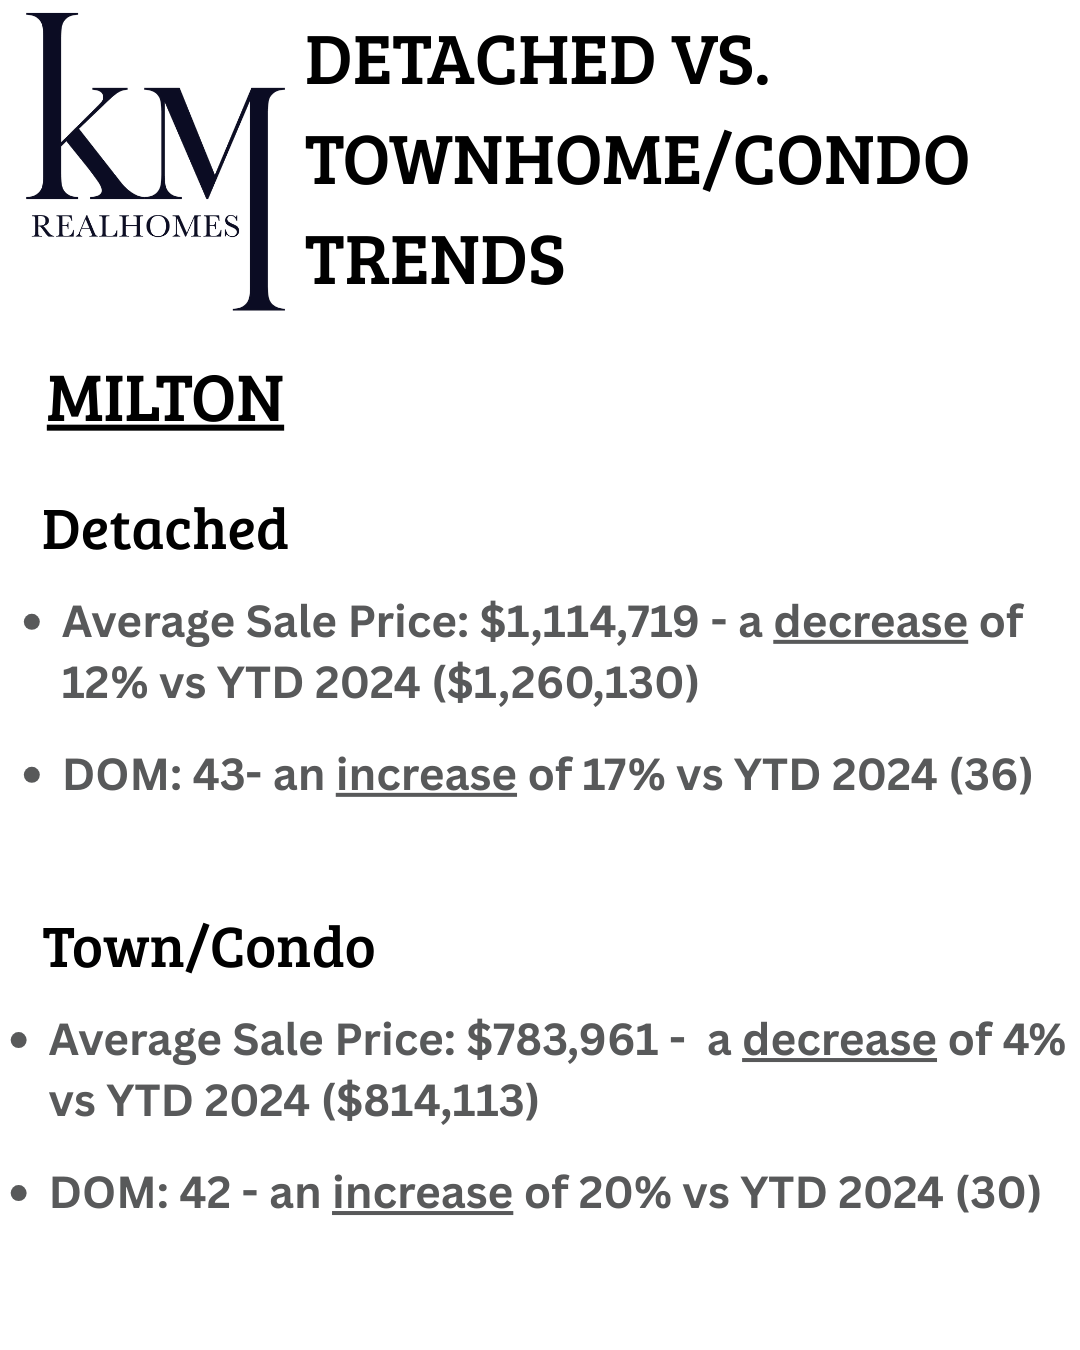
Milton continues to reflect a more price-sensitive market.
Detached homes averaged $1,114,719, down 12% year over year, with days on market increasing to 43 days.
Townhomes and condos averaged $783,961, down 4% year over year, with days on market rising to 42 days.
While pricing has softened, activity has remained relatively steady thanks to Milton’s lower overall price point compared to Oakville and Burlington.
What This Means Heading Into 2026
Buyers may find the strongest negotiating opportunities in Oakville, particularly in established detached neighbourhoods where some owners are looking to downsize.
Sellers in Burlington are still well positioned, provided pricing aligns with current conditions, to sell.
Across Halton, longer days on market are becoming the norm — strategy, preparation, and local insight matter more than ever.
As always, market statistics are most meaningful when applied at a neighbourhood and property-type level. A detached home in one Oakville neighbourhood can perform very differently from another just a few kilometres away.
If you’d like to dig deeper into how these trends apply to your specific home or buying plans, I’m always happy to walk through the numbers and strategies with you.